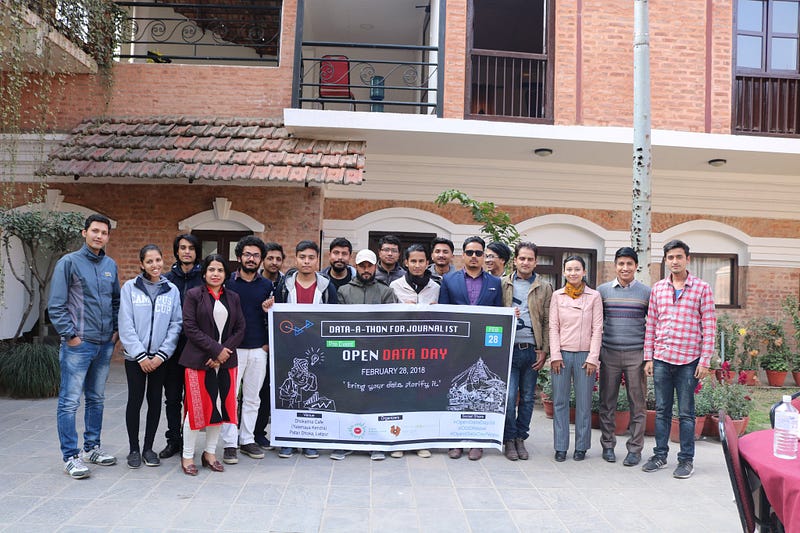
Data-a-thon For Journalist


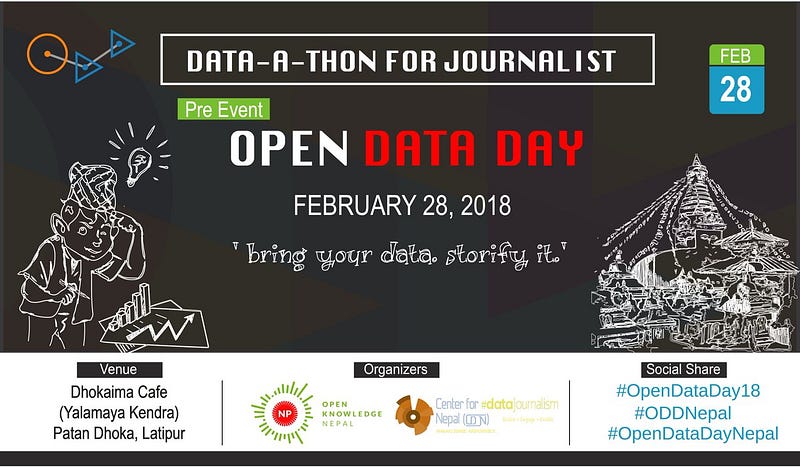
Open Knowledge Nepal (OKN) and Center for Data Journalism Nepal (CDJN) hosted the data-a-thon, a pre-event to the open data day, on 28th February 2018. The data-a-thon was unique in its model where Journalist across print, digital and broadcast platforms where present along with the students/professionals of information technology.
With the view to inspire data-driven storytelling, the program was modeled in two phases. 1st technical presentation and 2nd interaction phase.
As a first speaker, Nikesh Balami, CEO of Open Knowledge Nepal, kicked off the session with his presentation on “Working with data”. The presentation included the technological tools and process needed for data journalism. The basic steps involved in working with data included namely data extraction, data cleaning, data analysis, data visualization and data publishing. Some of the amazing free tools that can even be used by people without technological background were cited. You can visit open data handbook for more details regarding such tools. He also pointed out that telling a visual data story is something that will remain in mind and urges to take action.
Our CEO Mr. Nikesh Balami @nikeshbalami giving presentation on “Working with Data” at Open Data Day pre event “Data-a-thon for Journalists”. #ODD18 #OpenDataDayNepal pic.twitter.com/ltd7fPqSAU
— Open Knowledge Nepal (@okfn_np) February 28, 2018
Arun Karki, from CDJN, gave the presentation more on the ‘why’ and culture aspect of data journalism in Nepal. With data visualization, one can engage public, be a sense-maker, and ultimately contribute to reaching the information accessible to all. He also described how interactive the map can be such that we get the sense of what it is. One of the examples presented was, how the source of cholera outbreak was found out after mapping the affected regions. Visualization can give much more than information, it can give knowledge.
Supriya Manandhar, Record Nepal
– How the gap between research and its use has dampened the development
– Inspiration from, Edward Tufte, Lev Manovich, R Luke DuBois for use of data and technology in storytelling
– Data visualization, knowledge visualization has a key to the modern form of storytelling
– Why data visualization? To break the mathematical jargon
– Tools used: InVivo, Tableau public VUE, knightlab tools, online whiteboards Google sheets, image editing software
Rudra Pangeni, Republica,
– Comparing data gives powerful effect,
– In one survey, it is found that Sindhuli possessed roughly 200 trained manpower, meaning it would require 130 more years to complete the 25k households destroyed by the earthquake.
– After Comparing and contrasting bidding cost, he found match-fixing is done by contractors.
– Data visualization can be the Narration to present people’s life
Tech volunteers from Open Knowledge Nepal interacting with Journalists and trying to solve their data related problems at Open Data Day pre-event “Data-a-thon for Journalists”. #DataJournalism #OpenDataDayNepal #ODD2018 pic.twitter.com/NabIwM95R0
— Open Knowledge Nepal (@okfn_np) February 28, 2018
Technology and journalism collaborative platform
After the technical presentations, the floor was open for interaction. The lunch session had already brought participants close to each other. The combination of journalists and students/developers from technology field made the session more effective. They worked together to make the sense of the data. Some of them were presenting data in maps, some wherein graphs, and charts. Some used python programming whereas some used the tools written in the open data handbook. The result was good considering the length of the program. Some were suggesting this type of workshops should happen on a regular basis so that they get more time to collaborate and bring good results.
Judging from the reaction of the participants, the program showed new dimensions in making our community more data friendly. The program was indeed a successful one. Professionals from journalism and computer field came together to make sense of news and data. Hopefully, this culture develops into something substantial, ultimately contributing to the community.