
Blog
Inside Nepal’s University Classroom: What the Numbers Reveal


Shanna Aryal
|Fri Jul 18 2025
Did you know Nepal’s university enrollment hit a record high in 2080/81, just a few years after a sharp dip? Behind these numbers lies a story of resilience, gender shifts, and a changing academic landscape.
Enrollment Trends: A Roller Coaster
For years, student enrollment grew steadily, until 2077/78, when it suddenly fell to its lowest in recent memory. The reasons? Disruptions like the pandemic, economic uncertainty, and academic delays likely played a role.
But the comeback was remarkable: by 2080/81, enrollment didn’t just recover, it reached a historic peak.

Source: University Grants Commission (UGC), Nepal. Data on annual enrollment trends.
Tribhuvan University: The Giant Among Universities
The rise isn’t about one campus, it’s about one university dominating the entire landscape.
More than half of all students in Nepal are enrolled at Tribhuvan University (TU). Why does TU overshadow others?
- Legacy & reach: Oldest university, with 1,000+ affiliated and constituent colleges nationwide.
- Accessibility: Affordable fees and programs are spread across the country.
- Capacity: Estimated to accommodate 500,000+ students annually.
Source: University Grant Commission (UGC).Aggregated university-wise enrollment figures. Data of year 2080/81.
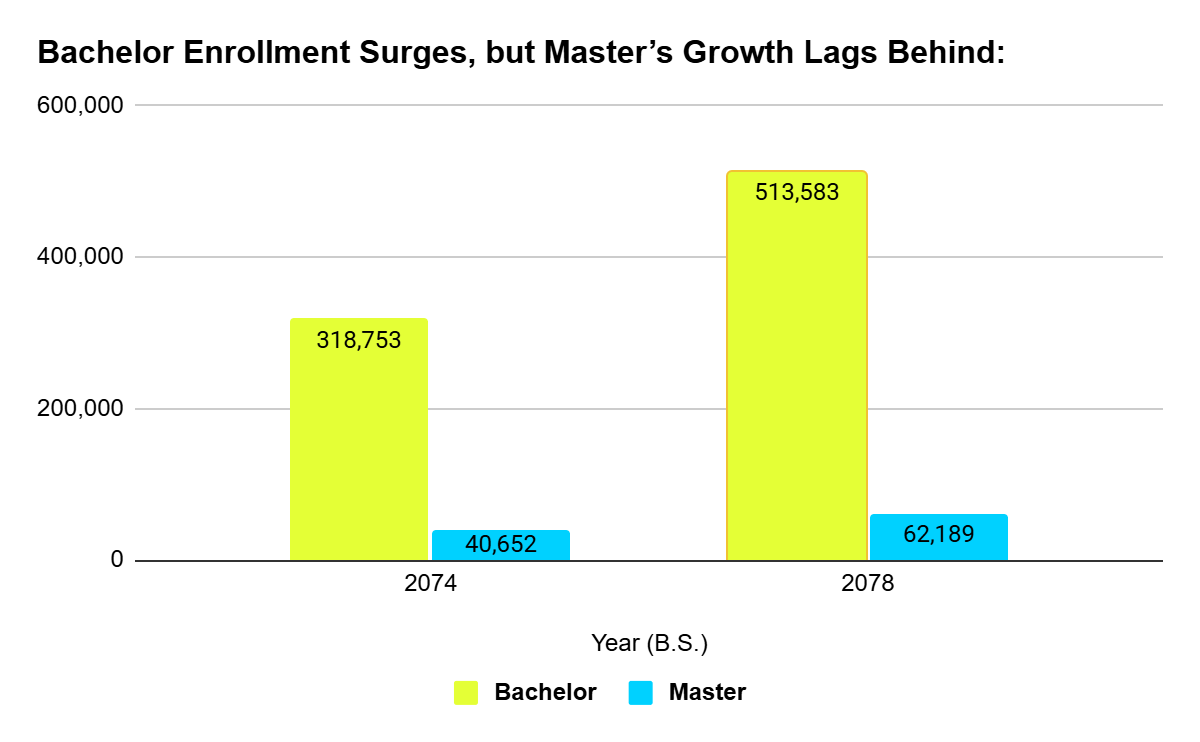
Bachelor’s Boom, Master’s Lag
Most students stop at the undergraduate level. Enrollment in bachelor’s programs is significantly higher than in master’s degrees, a trend influenced by financial pressures, job opportunities, and shifting priorities.
Notably, bachelor’s enrollment in 2078 was nearly double that of 2074, signaling strong progress in access to education.
Source: Open Data Nepal (ODN); Data by level
Data reflects public universities and their constituent/affiliated campuses only. Private institutions may not be fully represented.
Gender Balance: A Quiet Revolution
Walk into many classrooms today, and you’ll notice a shift: female students are catching up, sometimes even outnumbering males.
- Tribhuvan University: 1.2 males for every female
- Kathmandu & Purbanchal: Near gender parity
- Some institutions: More women than men enrolled
This isn’t just a statistic; it reflects changing social norms and growing opportunities for women in higher education.

Source: ODN; Enrollment by gender. Year 2080/81.
What Are Students Studying?
Across provinces, Management and Education dominate as the most popular faculties, while Science & Technology, Engineering, and Humanities also maintain a strong presence. This diversity suggests a shift toward regional academic priorities.

Source: ODN; Province-wise distribution;Year 2078/79
Faculties categorized as per the UGC framework: Management, Education, Science & Technology, Engineering, Humanities & Social Sciences.
The Bigger Picture
Nepal’s higher education is evolving faster, more inclusively, and more diversely than ever. But these numbers raise important questions:
- Will universities adapt to the demand for new skills?
- Can we ensure this growth translates into employment and innovation?
Yet, this is only part of the story. The data on students seeking higher education abroad would provide a more complete picture of the choices Nepali students are making, and what it means for the country’s education system and economy.
The story is still being written, one enrollment at a time.
About the Article and Data
This article reflects the author’s viewpoints based on the analysis of publicly available datasets for a specific timeframe. Therefore, this piece may not capture the entire picture of Nepal’s higher education landscape or all its underlying complexities.
This article is prepared and moderated by the Open Knowledge Nepal (OKN) editorial team. Data compilation and initial analysis were carried out by the OKN data intern team, with additional validation and formatting support from contributors at Open Data Nepal.
The data used for this article was sourced from the University Grants Commission (UGC), Nepal, and aggregated datasets from Open Data Nepal (ODN). The dataset primarily includes enrollment data of public universities and their constituent/affiliated colleges; private institutions may not be fully represented.


