
Publishing and Exploring Data Just Got Easier on Open Data Nepal

With the launch of AI integration on Open Data Nepal, we also shipped two other significant upgrades to the platform: Seamless Publishing and the Comprehensive Data Explorer. This post covers both. Whether you want to contribute data or explore what is already there, these features were built with you in mind.
Seamless Publishing
Contributing a dataset to Open Data Nepal previously required navigating the CKAN backend, a process that worked but was not friendly for researchers, journalists, or contributors who are not technical users. That changes now.
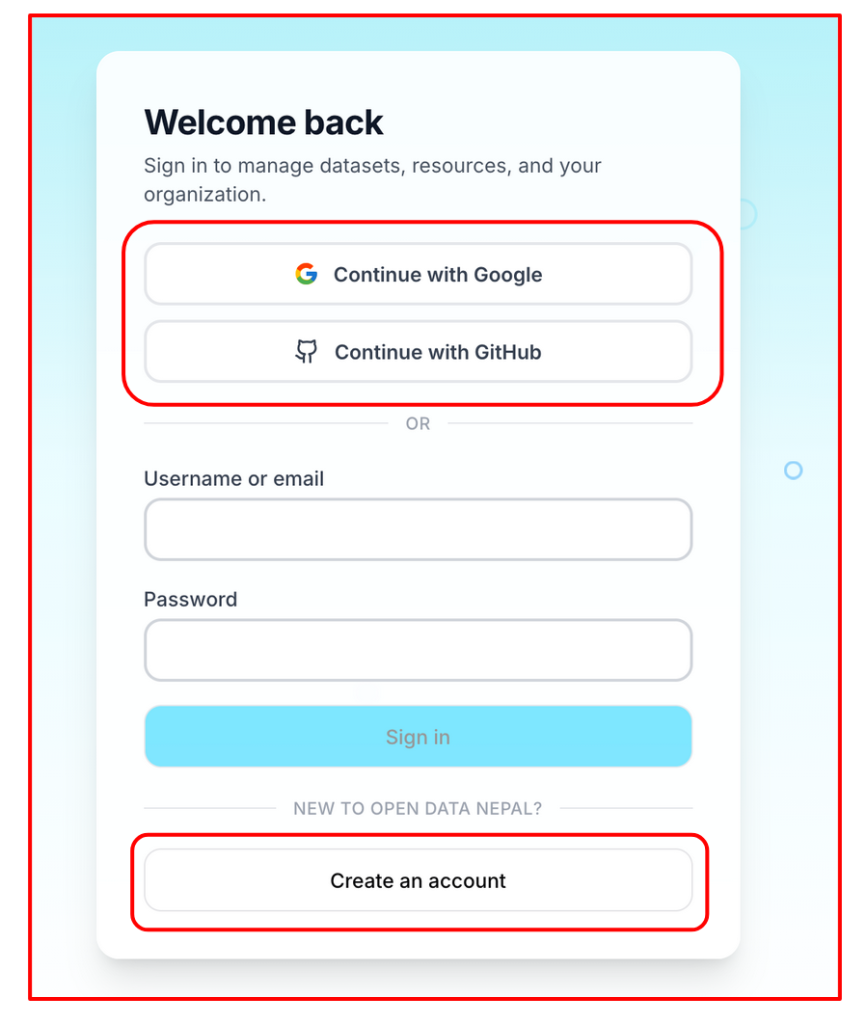
- Sign in your way: Users can create an account or sign in using Google, GitHub, or a standard email address. Whichever method you choose, you are in within seconds.
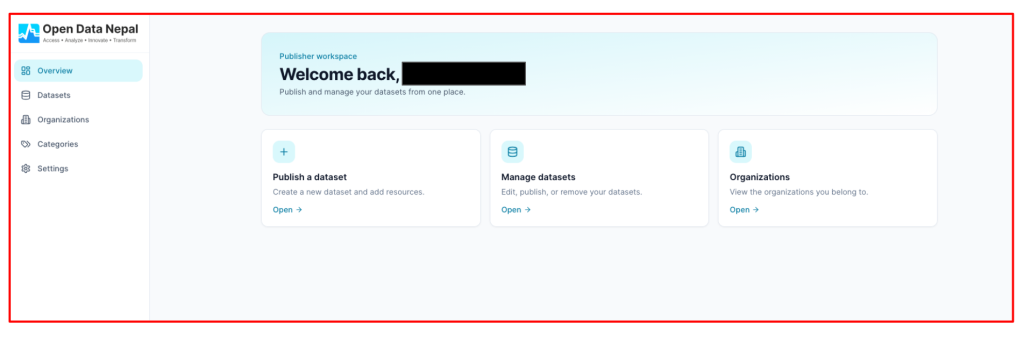
- Clean publishing dashboard: Once signed in, contributors have access to a dashboard organized around four areas: an Overview of your publishing activity, a Datasets list of everything you have published, an Organizations section showing the groups you belong to on the platform, and Categories covering the thematic areas your datasets fall under.
- Publishing a new dataset: Clicking “New Dataset” opens a form where you can provide a title, URL, organization, license, description, tags, and source. The organization field is optional. If left blank, the dataset is held as unaffiliated until you join or are added to an organization. Once the details are filled in, you upload the file and publish. The process takes just a few minutes.
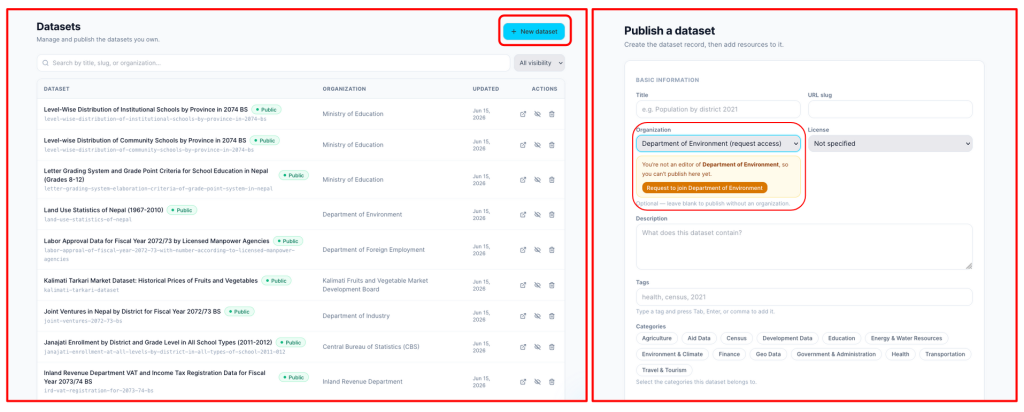
If you are not yet part of an organization, you can request to join one directly through the dashboard. Once approved, your datasets can be attributed to that organization.
Not sure how to fill in your dataset metadata or where to start? The AI assistant is available directly within the publishing dashboard. If you find any step confusing, whether it is choosing the right license, writing a description, or understanding what a metadata field means, you can ask the AI and get guidance without leaving the page.
Comprehensive Data Explorer
The Comprehensive Data Explorer brings visual and analytical exploration directly into the browser for everyone, without downloading files or opening external tools.
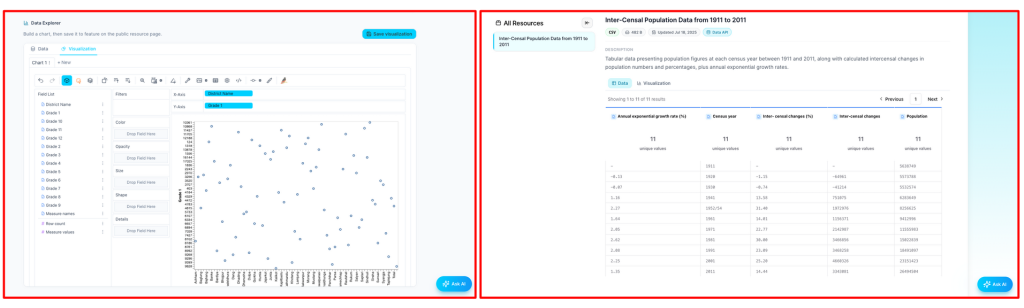
Every dataset can now be viewed in table view, the familiar row-and-column format, or visual view, where charts and graphs make patterns immediately visible. Users can switch between these freely.
- Publishers can set default visuals: When publishing a dataset, contributors can configure default visualizations, deciding in advance which charts are most meaningful so that anyone opening the dataset sees those visuals first. This helps guide users toward the most important findings from the moment they open it.
- Anyone can build or explore their own visualizations: Any user, whether they published the dataset or are visiting for the first time, can build their own visualizations independently using a drag-and-drop interface. Drag a field onto an axis, select a chart type, and the visualization is generated instantly. Users can filter, compare subsets, and explore trends across different dimensions, all within the platform.
What This Means Together
Seamless Publishing and the Comprehensive Data Explorer address the two sides of the open data equation: contributing data and using data. Making it easier to publish brings more datasets to the platform with richer metadata. Making it easier to explore means more people can engage with those datasets rather than simply downloading and setting them aside. Together with the AI integration, Open Data Nepal is now a platform where anyone can find, understand, analyze, and contribute data without needing to be a data expert.
Nepal’s data is open. Now the tools to work with it are open too.
